Methodology

Fibonacci + Cycle Ratio Research Logic

This page explains how FibraX builds cycle anchors, ratio bands, and projection zones. The model is designed for structured research and visualization, not deterministic forecasting.

00

Visual Method Walkthrough

The following TradingView snapshots document the exact manual process used to derive Fib bear levels and cycle bull-ratio scenarios in this project.

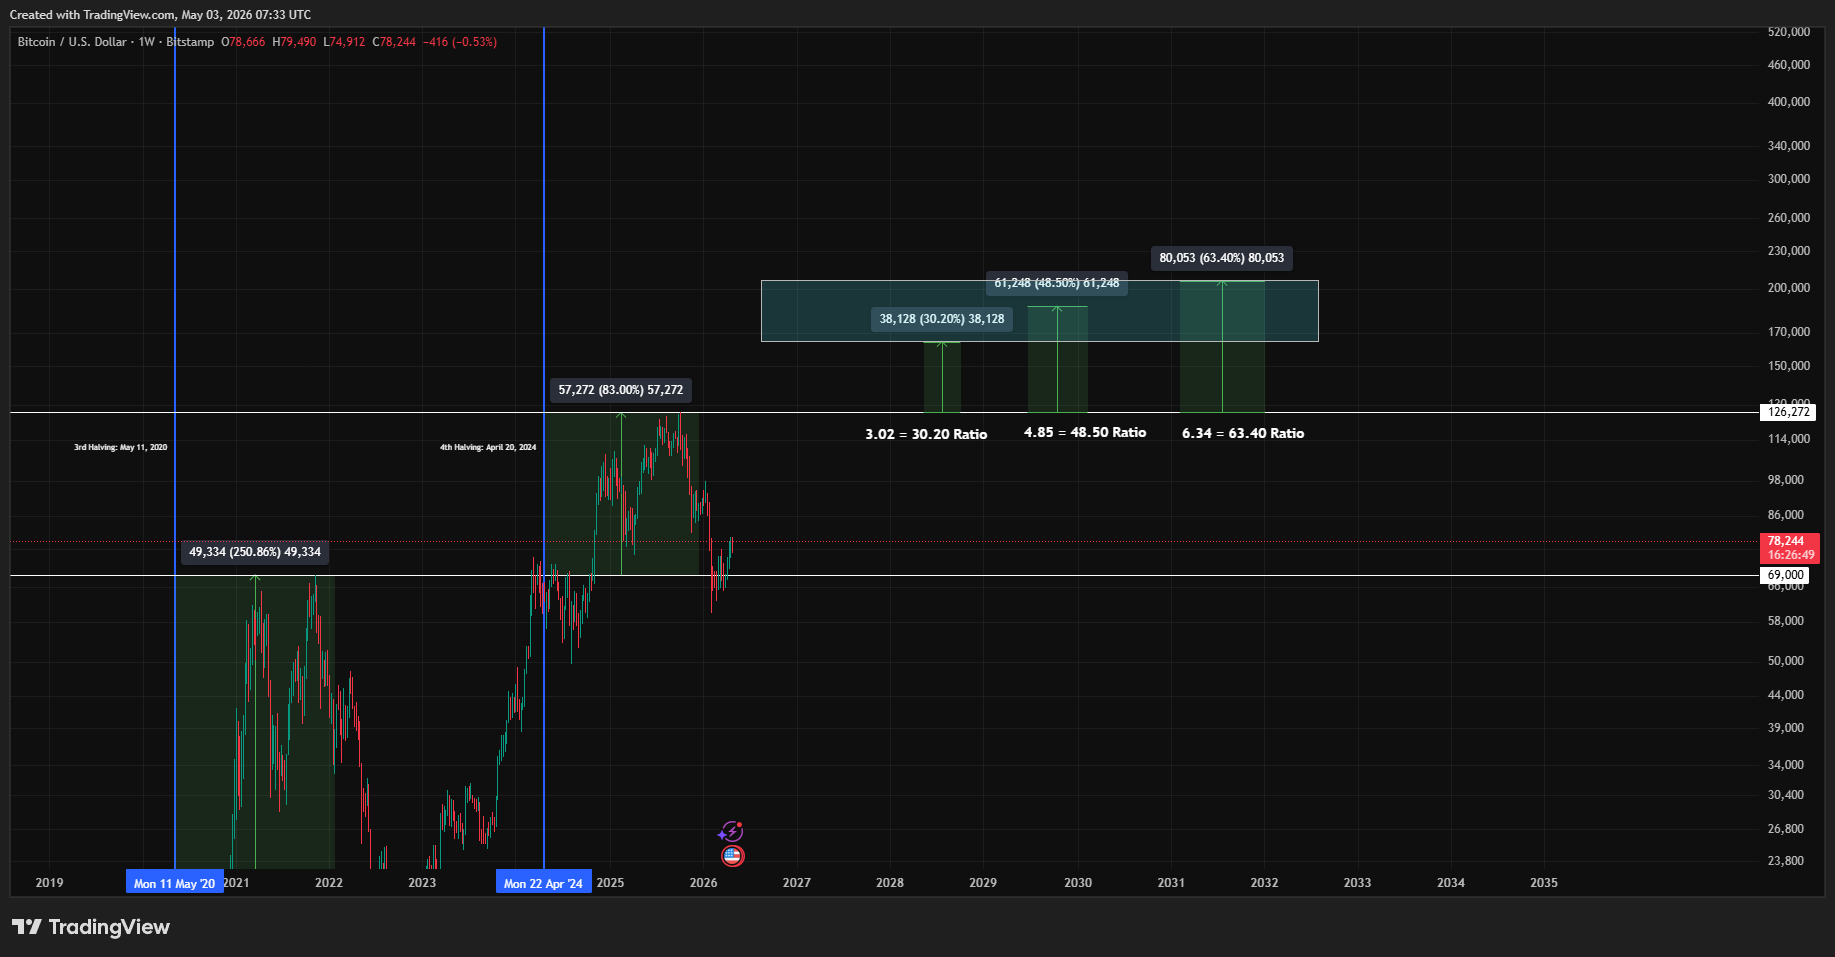
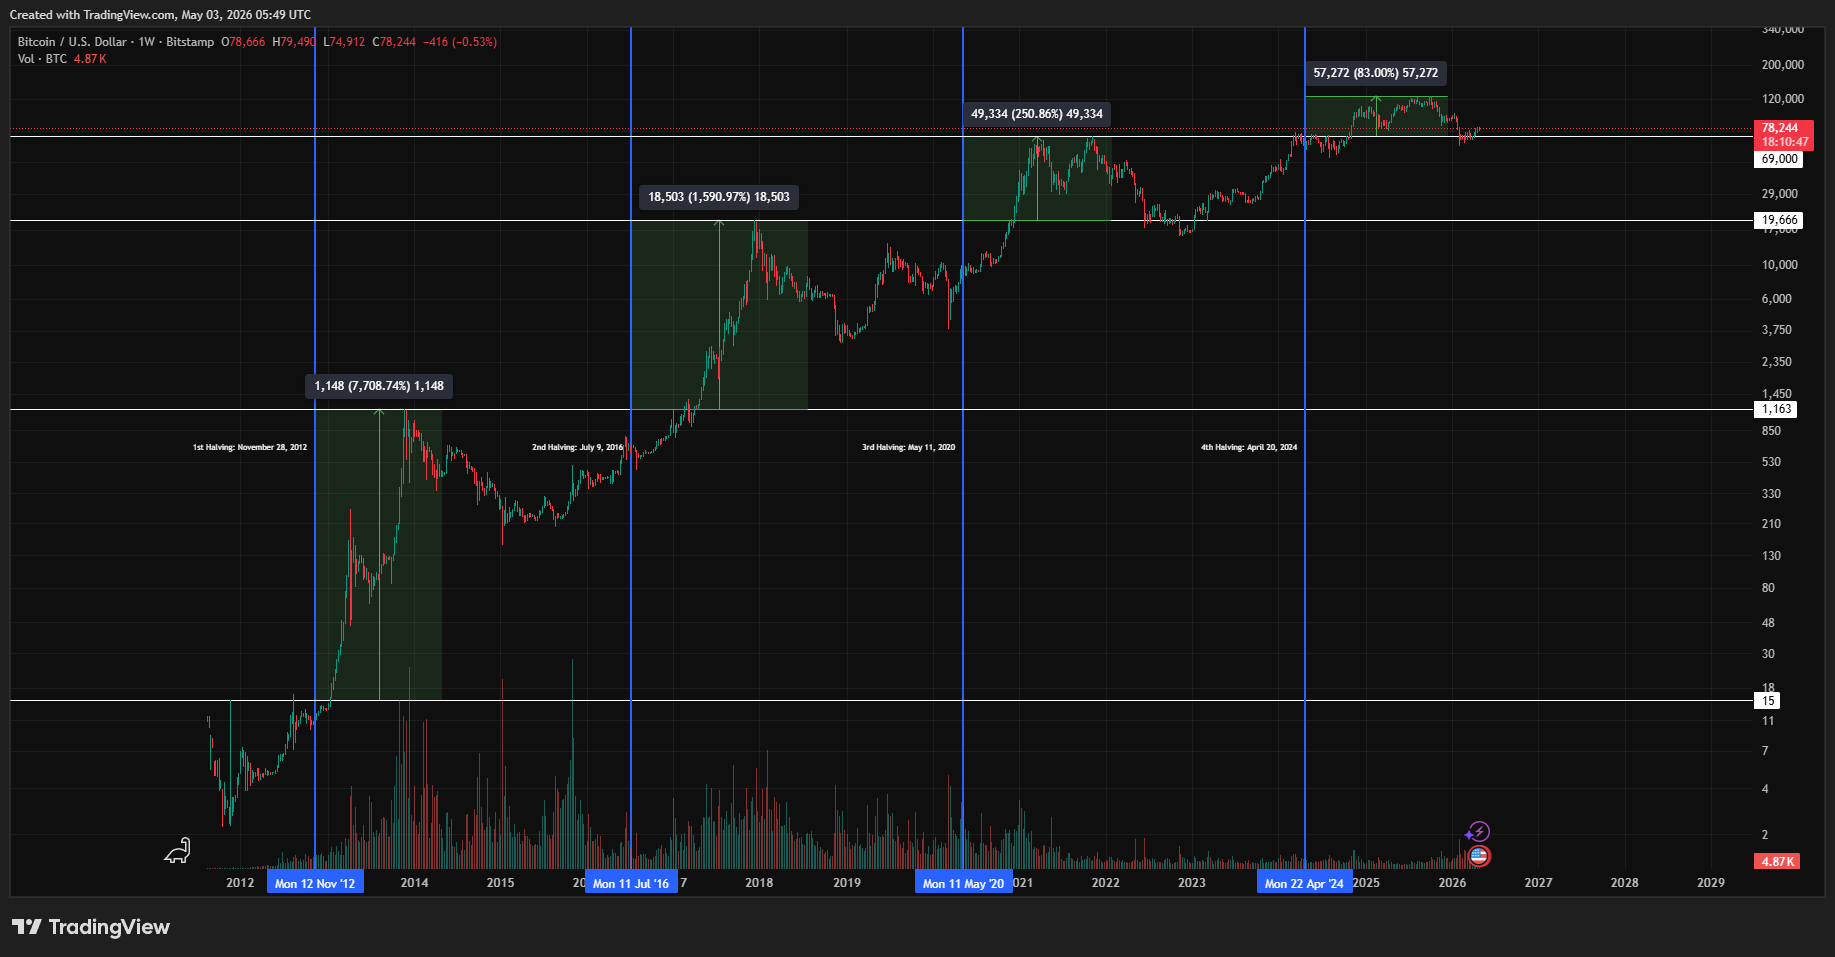
Cycle Overview with Halving Markers

High-level view of Bitcoin cycle structure with halving dates and measured bull ranges used as primary research anchors.

  • Vertical halving markers separate cycle regimes.
  • Green range blocks capture cycle-level expansion magnitude.
  • These ranges are the base input for ratio comparison logic.
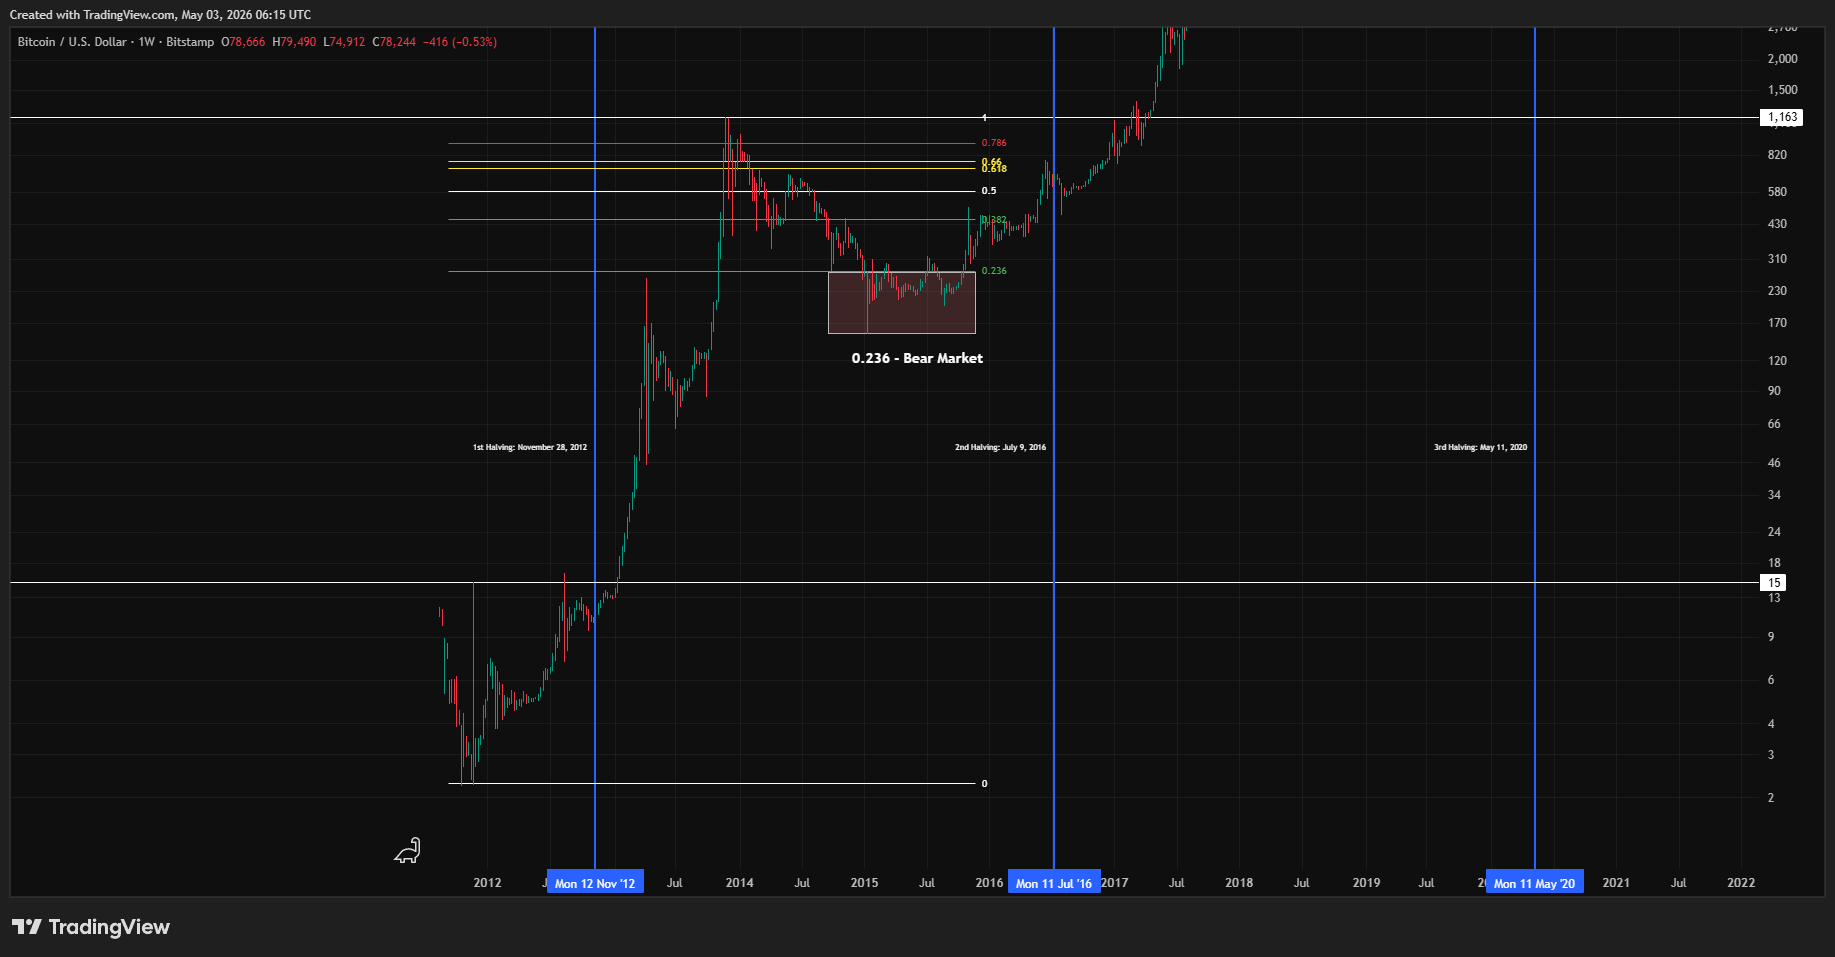
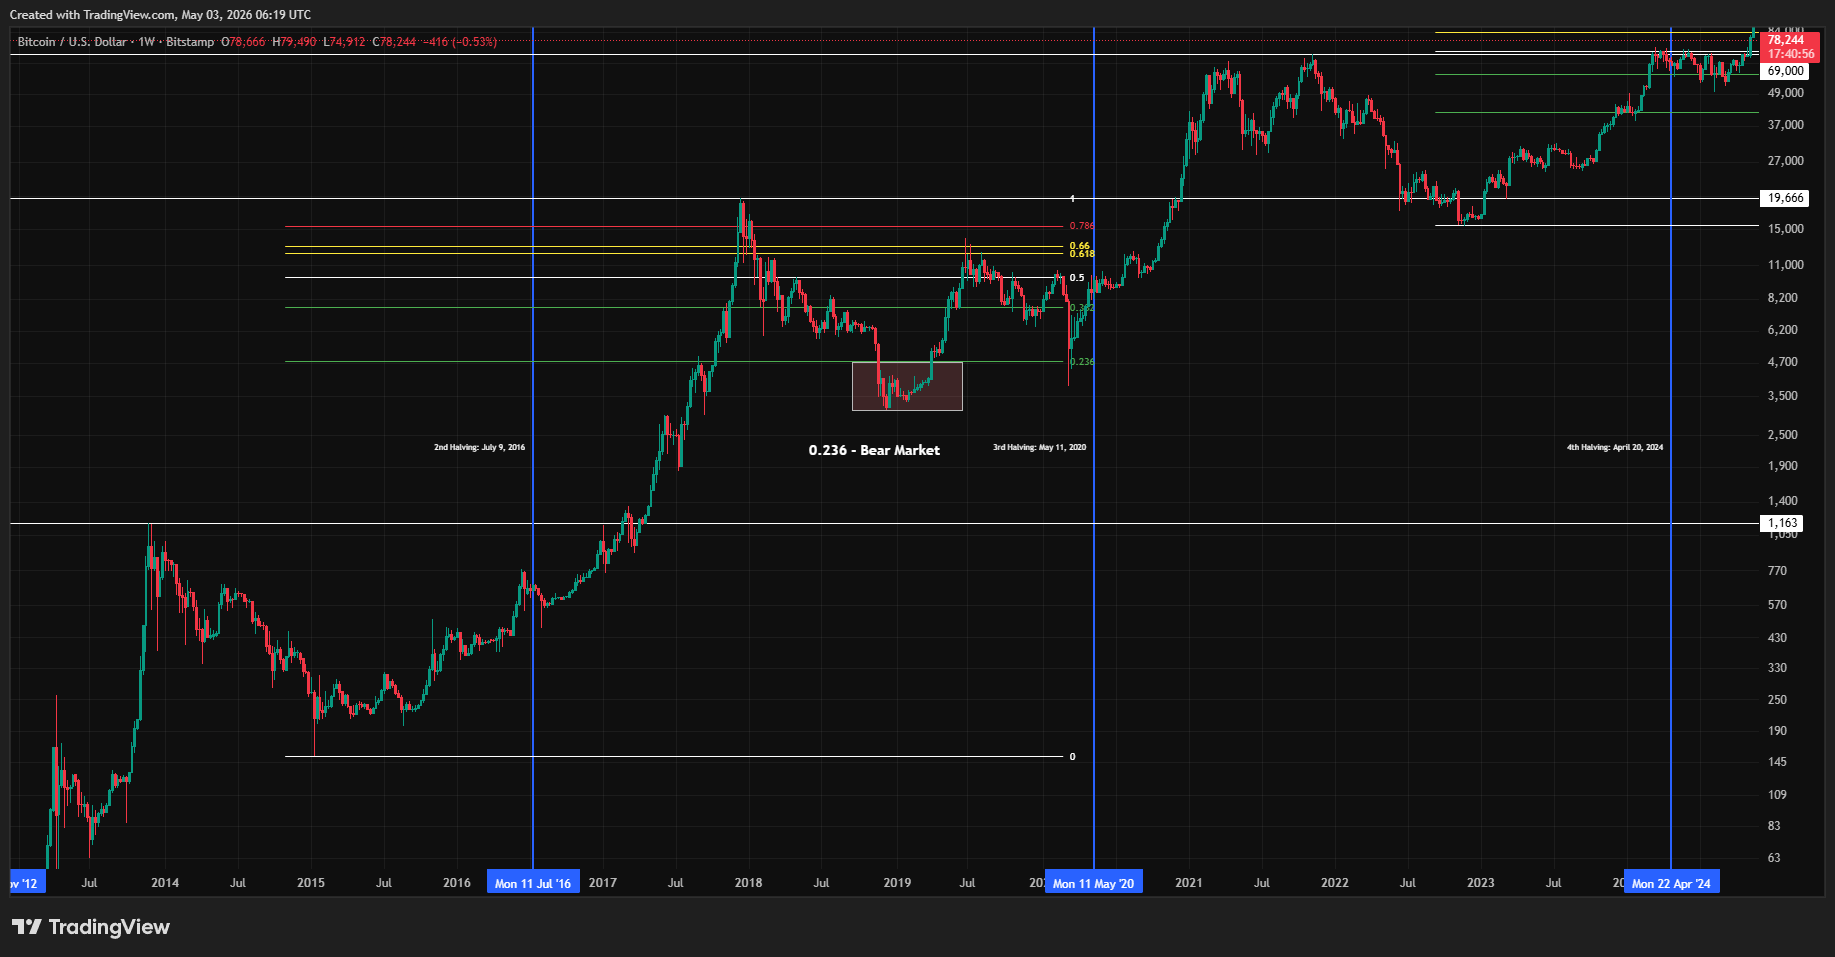
1st Cycle Bear Mapping (2011-2015)

Fib retracement is drawn from cycle ATH to prior cycle low, then Fib 0.236 is used as the bear-start reference and compared to realized low.

  • Anchor pair: $1,163 high and $2 low.
  • Fib 0.236 reference marks bear start zone.
  • Drawdown from Fib 0.236 to realized low is tracked.

2nd Cycle Bear Mapping (2015-2018)

Same rule set is repeated to keep methodology deterministic and comparable across cycles.

  • Anchor pair: $19,666 high and $152 low.
  • Fib 0.236 becomes the bear-start baseline.
  • Observed drawdown is logged for historical drift analysis.

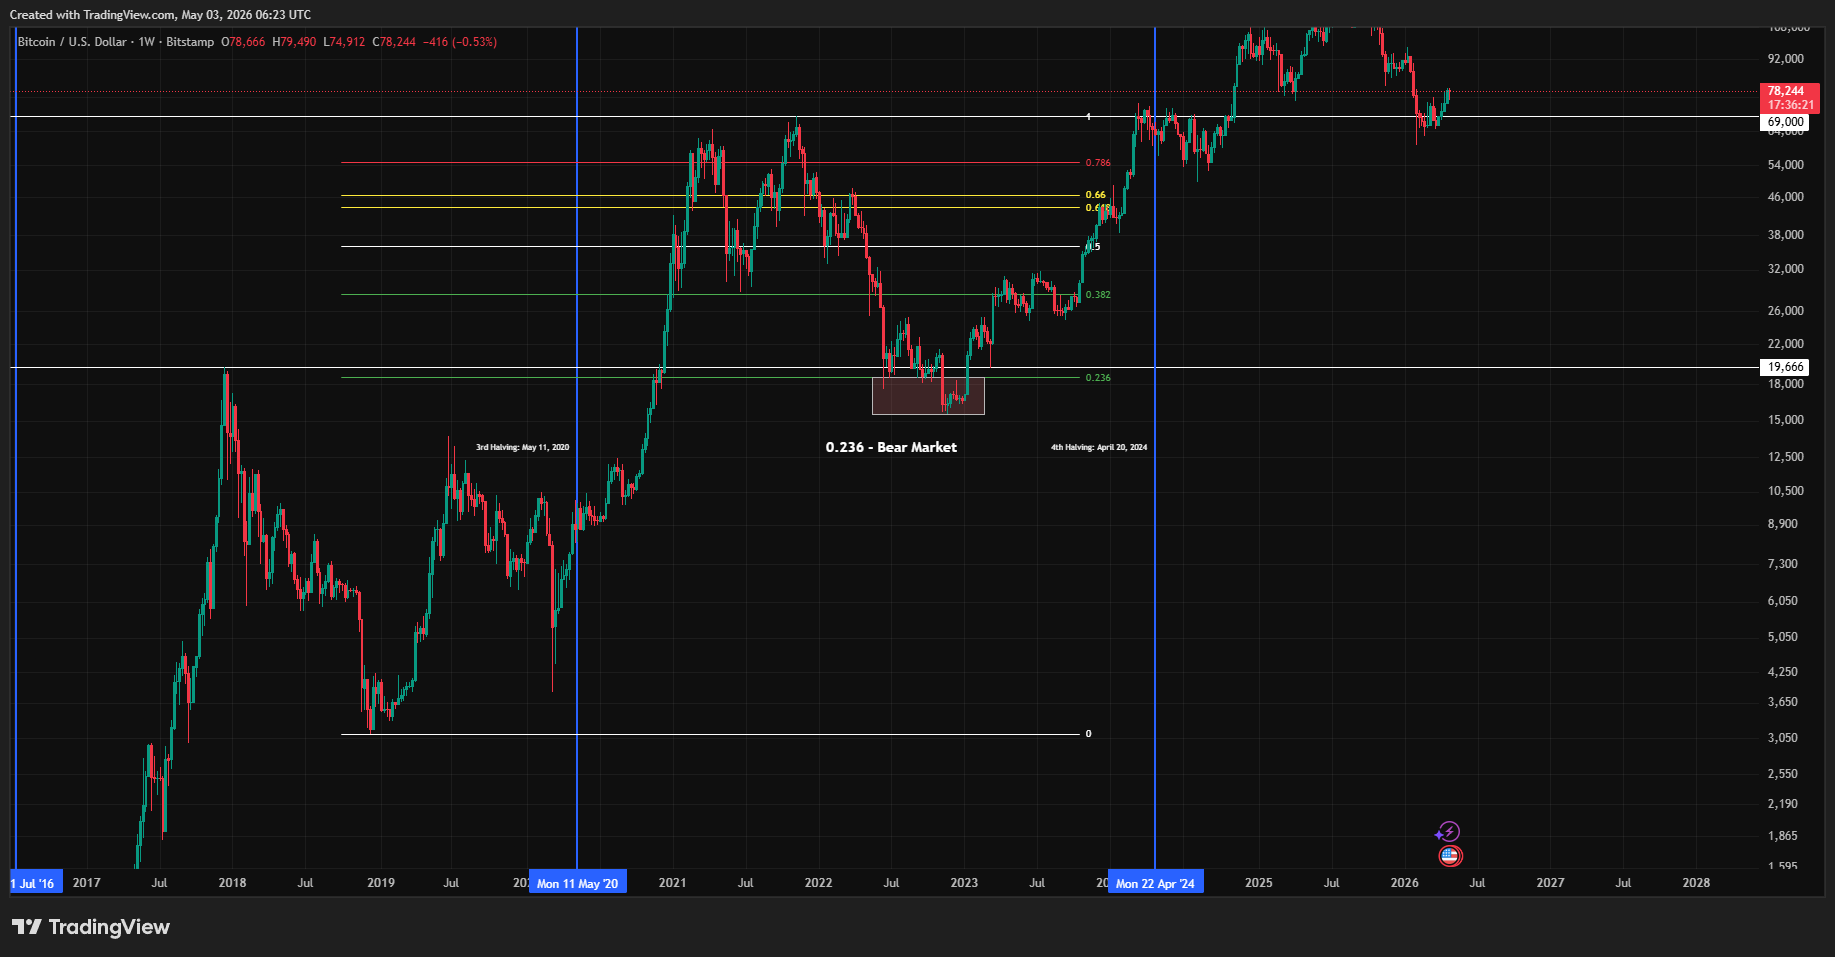
3rd Cycle Bear Mapping (2018-2022)

The third cycle validates the same Fib process and provides the latest completed bear drawdown reference before current-cycle assumptions.

  • Anchor pair: $69,000 high and $3,122 low.
  • Fib 0.236 level is measured against realized low at $15,479.
  • Result contributes to the base-case bear hypothesis.

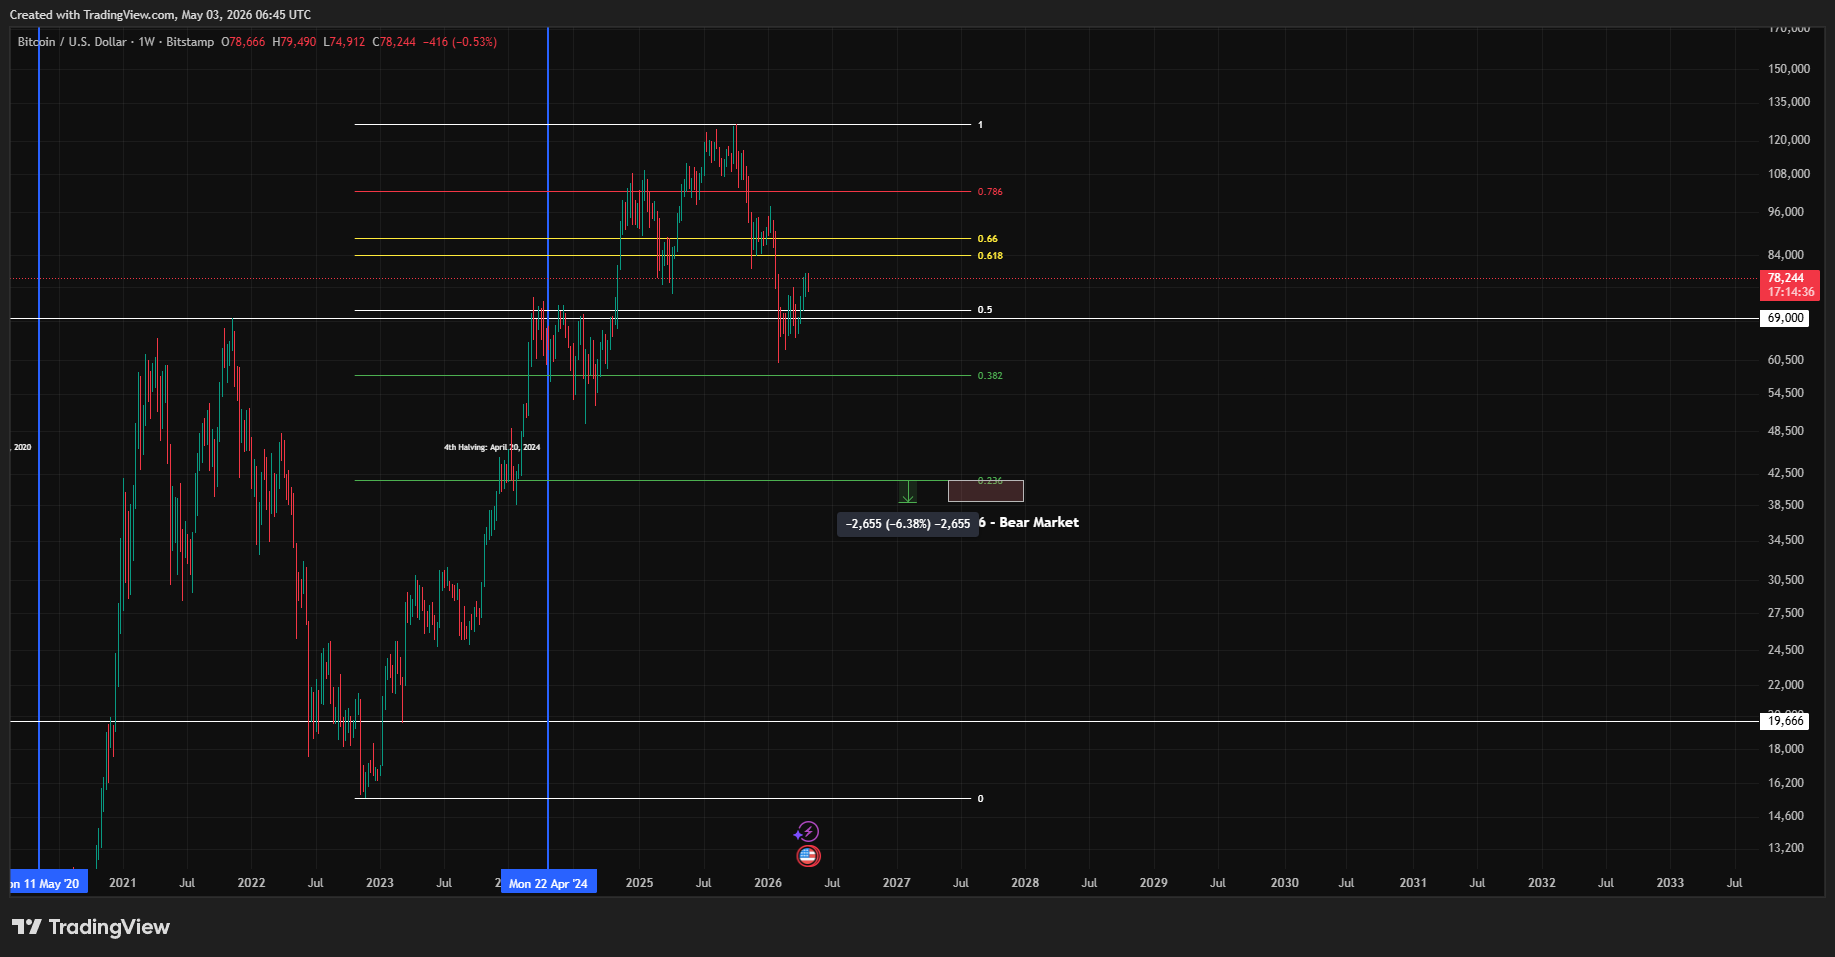
4th Cycle Base-Case Bear Scenario (2022-Present)

Current-cycle bear mapping applies scenario drawdowns from the same Fib 0.236 anchor because the full cycle is still in progress.

  • Anchor pair: $126,272 high and $15,479 prior low.
  • Fib 0.236 defines the bear-start reference around $41k.
  • Scenario drawdowns: shallow (-6.38%), base (-12%), stress (-20%).

Bull Ratio Range and Projection Bands

Historical bull-return compression is converted into scenario bands, then projected from the latest ATH to build conservative, median, and extension zones.

  • Ratio compression references: 3.02, 4.85, and 6.34.
  • Scenario bands are applied as percentage expansions from cycle ATH.
  • Outputs are interpreted as zones, not guaranteed targets.
01

What the model measures

The model tracks a repeating loop: bear-level estimation from Fibonacci retracement, then bull-level scenario projection from cycle ratio behavior.

  • Bear start reference: Fibonacci 0.236 calculated from ATH to previous cycle low.
  • Bear low scenarios are measured from the same 0.236 anchor using shallow/base/stress drawdown assumptions.
  • Bull projection zones: +30.20%, +48.50%, +63.40% above the latest cycle ATH.
  • Phase interpretation: prices are mapped to scenarios, not deterministic targets.
02

How cycle bottoms and tops are selected

Anchors are chosen on weekly structure and tied to halving-cycle context for consistency across historical comparisons.

  • 2011-2015 anchor: low $2 (Oct 17, 2011), peak $1,163 (Nov 25, 2013).
  • 2015-2018 anchor: low $152 (Jan 12, 2015), peak $19,666 (Dec 11, 2017).
  • 2018-2022 anchor: low $3,122 (Dec 10, 2018), peak $69,000 (Nov 8, 2021).
  • 2022-present anchor: low $15,479 (Nov 21, 2022), peak $126,272 (Oct 26, 2025 model anchor).

Cycle 1

2011-2015

completed

Bottom

October 17, 2011

Halving

November 28, 2012

Peak

November 25, 2013

Bear Bottom

January 12, 2015

Cycle 2

2015-2018

completed

Bottom

January 12, 2015

Halving

July 9, 2016

Peak

December 11, 2017

Bear Bottom

December 10, 2018

Cycle 3

2018-2022

completed

Bottom

December 10, 2018

Halving

May 11, 2020

Peak

November 8, 2021

Bear Bottom

November 21, 2022

Cycle 4

2022-Present

active

Bottom

November 21, 2022

Halving

April 20, 2024

Peak

October 26, 2025 (model anchor)

Bear Bottom

In progress

03

Fibonacci ratio logic

FibraX uses a fixed Fibonacci retracement set and a ratio-based projection method to define bull/bear zones.

  • Retracement set: 0, 0.236, 0.382, 0.5, 0.616, 0.66, 0.786, 1.
  • Bear process: ATH -> previous low, then read 0.236 as bear-start reference.
  • Bear scenarios from 0.236: shallow (-6.38%), base (-12%), stress (-20%).
  • Bull process: use historical bull percentages and derive ratio range 3.02-6.34.
  • Current bull scenarios from $126,272 ATH: $164,400, $187,250, $206,325.
04

Historical cycle results

Historical bear-market checks compare the 0.236 starting point with realized lows to quantify drawdown drift.

  • 2011-2015 drawdown from Fib 0.236 to low: -45.13%.
  • 2015-2018 drawdown from Fib 0.236 to low: -34.27%.
  • 2018-2022 drawdown from Fib 0.236 to low: -17.10%.
  • Current cycle uses scenario banding: shallow (-6.38%), base (-12%), stress (-20%).

2011-2015

Fib 0.236 Start$277
Assumed Low$152
Drawdown-45.13%

2015-2018

Fib 0.236 Start$4,768
Assumed Low$3,122
Drawdown-34.27%

2018-2022

Fib 0.236 Start$18,678
Assumed Low$15,479
Drawdown-17.10%

2022-2025

Fib 0.236 Start$41,604
Assumed LowScenario-based (in progress)
Drawdown-6.38% / -12% / -20%
05

Limitations

The model is research-oriented and can fail when market structure changes under new macro, liquidity, or policy conditions.

  • Past cycle similarity does not guarantee future repetition.
  • Structural breaks can invalidate previously reliable ratios.
  • External shocks can move price outside projected zones quickly.
  • The dashboard is not financial advice and should not be used as a sole decision system.

Disclaimer

FibraX is for educational and research purposes only. It is not financial advice, not an investment recommendation, and not a guarantee of future market behavior.